Field notes
How to debug an MCP server
A stray stdout line in a stdio MCP server usually does not crash it. It gets swallowed. Here is what really happens, and how to debug one properly.
Mark
Head of Marketing, MCPOrbit
- Published
- Updated
- · Updated
- Read time
- · 9 min read
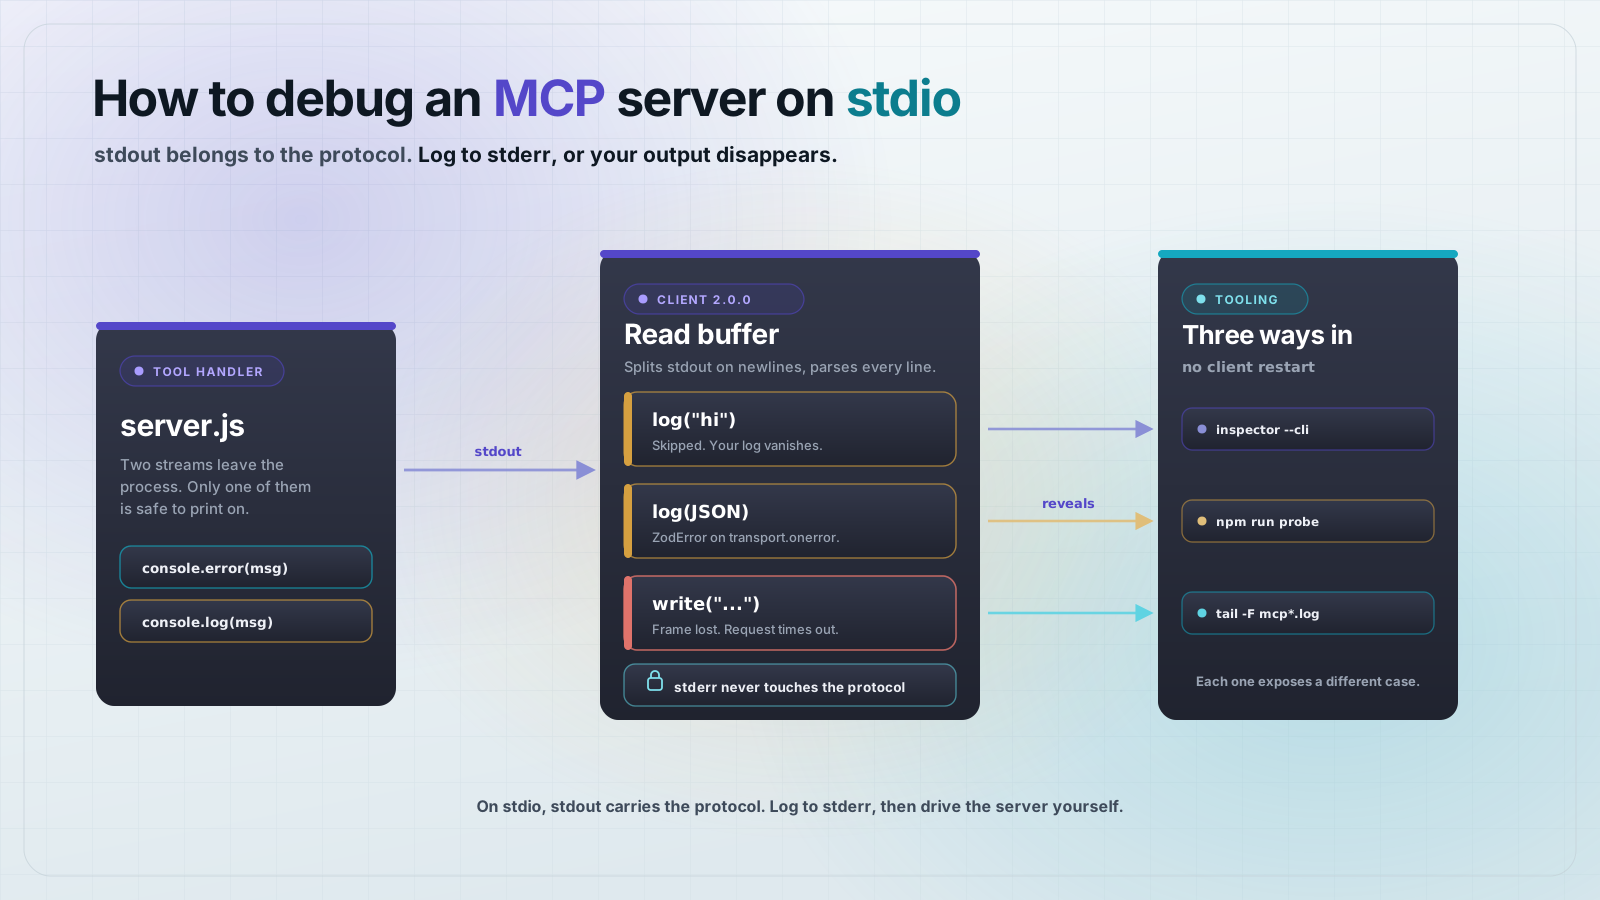
To debug a Model Context Protocol (MCP) server on stdio: log to stderr instead of stdout, drive the server directly with the MCP Inspector CLI, and keep a small probe client you can run in one command. Never write to stdout. On stdio, stdout is the protocol channel, not a place to print things.
The advice you will usually hear is that console.log corrupts the protocol frame and crashes the connection. That is not what happens, at least not with the current SDK, and the real behavior is worse. A stray whole line on stdout is silently discarded. Your log never appears, the call still succeeds, and nothing anywhere tells you a line went missing. The case that does break you looks harmless and is covered further down.
Why can you not use console.log in an MCP server?
A stdio MCP server talks to its client over the process's own standard input and output. The client writes JSON-RPC requests to the server's stdin and reads responses, one JSON object per line, from its stdout. That is the entire transport. There is no separate socket and no framing header, just newline-delimited JSON.
So console.log writes to the same stream the protocol uses. The MCP docs are blunt about it: local MCP servers should not log to stdout, as this will interfere with protocol operation. What the docs do not tell you is what interference actually looks like, and that turns out to matter a great deal when you are staring at a server that half works.
What actually happens when you write to stdout?
I built a one-tool server and ran a real client against it over real stdio, changing only the logging line. Versions pinned: @modelcontextprotocol/server 2.0.0, @modelcontextprotocol/client 2.0.0, zod 4.2.1, on Node v25.8.1. Three different stdout writes, three different outcomes.
// Case 1: a plain line. Silently discarded.
console.log("count_words called");

// Case 2: valid JSON, invalid JSON-RPC. Raises on transport.onerror.
console.log(JSON.stringify({ event: "count_words", text }));

// Case 3: no trailing newline. Eats the next real frame.
process.stdout.write("working...");
Case 1 is the surprising one. The tool call returns {"content":[{"type":"text","text":"4"}]} exactly as it should, and the log line is gone. Not redirected, not buffered, gone. The reason is in the client's read buffer: it splits stdout on newlines and tries to parse each line, and a line that throws a SyntaxError is skipped and the loop moves on.
// @modelcontextprotocol/client 2.0.0, ReadBuffer.readMessage()
try {
  return deserializeMessage(line);
} catch (error) {
  if (error instanceof SyntaxError) continue;
  throw error;
}Case 2 gets further. JSON.parse succeeds, so it is not a SyntaxError, and the JSON-RPC schema check rejects it instead. That error is real and it propagates to the transport's error handler. The call still returns 4, because the next line on the wire is the genuine response, but you now get a stack of schema noise for every tool invocation.
[transport.onerror] ZodError: [
  {
    "code": "invalid_union",
    "errors": [
      [
        {
          "code": "invalid_value",
          "values": [
            "2.0"
          ],
          "path": [
            "jsonrpc"
          ],
          "message": "Invalid input: expected \"2.0\""
        },
You only ever see that if you assigned transport.onerror. If you did not, the SDK calls an undefined handler and the error evaporates. Set it. It costs two lines and it is the difference between a mystery and a message.
Case 3 is the one to actually fear. process.stdout.write("working...") emits no newline, so the buffer never sees a line boundary. The next thing written to stdout is the real JSON-RPC response, and it arrives glued to the back of your text. The combined line fails JSON.parse, hits the SyntaxError branch, and is skipped. The response is destroyed in transit and the client waits for a reply that already came and went.
call failed: SdkError Request timed outA timeout with no error on either side, from one write with a missing newline. This is the failure that sends people hunting through their tool logic for an infinite loop that is not there.
How should an MCP server log instead?
Write to stderr. On stdio the host application captures the server's stderr automatically, so your logs land somewhere useful without touching the protocol stream. In Node that means console.error, or anything else that targets file descriptor 2.
Here is the full server. Create a directory, drop in these two files, and run npm install.
{
  "name": "wordcount-mcp",
  "version": "1.0.0",
  "type": "module",
  "scripts": {
    "start": "node server.js",
    "probe": "node probe.js"
  },
  "dependencies": {
    "@modelcontextprotocol/client": "2.0.0",
    "@modelcontextprotocol/server": "2.0.0",
    "zod": "4.2.1"
  }
}
// server.js
import { McpServer } from "@modelcontextprotocol/server";
import { StdioServerTransport } from "@modelcontextprotocol/server/stdio";
import { z } from "zod";
const log = (...args) => console.error("[wordcount]", ...args);
const server = new McpServer({ name: "wordcount", version: "1.0.0" });
server.registerTool(
"count_words",
{
title: "Count words",
description: "Count the words in a string.",
inputSchema: { text: z.string().describe("The text to count words in.") },
},
async ({ text }) => {
log("count_words in:", JSON.stringify(text));
const count = text.trim().split(/\s+/).filter(Boolean).length;
log("count_words out:", count);
return { content: [{ type: "text", text: String(count) }] };
},
);
log("starting on stdio");
await server.connect(new StdioServerTransport());One log helper at the top, pointed at console.error, is the whole fix. Define it once and never think about the stream again. If you are tempted to send logs over the protocol instead, note that notifications/message is deprecated as of protocol version 2026-07-28, so stderr is the durable answer for local servers.
How do you test an MCP server without a client?
Use the MCP Inspector. It has a UI, but the CLI mode is the one that belongs in your loop, because it starts the server, runs a single method, prints the JSON result, and exits. No browser, no restart cycle.
npx @modelcontextprotocol/inspector@2.4.0 --cli node server.js \
  --method tools/list
{
"tools": [
{
"name": "count_words",
"title": "Count words",
"description": "Count the words in a string.",
"inputSchema": {
"type": "object",
"properties": {
"text": {
"type": "string"
}
},
"required": [
"text"
],
"$schema": "https://json-schema.org/draft/2020-12/schema"
}
}
]
}That output is the single most useful thing to look at when a server is not behaving. It is the exact schema the model will see. Most tool bugs that present as the model calling a tool wrongly are really schema bugs, visible right here.
Calling the tool works the same way. Arguments go in as repeated --tool-arg flags.
npx @modelcontextprotocol/inspector@2.4.0 --cli node server.js \
  --method tools/call \
  --tool-name count_words \
  --tool-arg text="the quick brown fox"
[wordcount] count_words in: "the quick brown fox"
{
"content": [
{
"type": "text",
"text": "4"
}
]
}The stderr log and the JSON result show up together, cleanly separated. Point the same command at the version of the server that used process.stdout.write and you get the whole diagnosis in one line.
{"error":{"code":"error","message":"Request timed out"}}How do you reproduce an MCP failure in one command?
Write a probe. It is about thirty lines, it runs the same handshake a real client runs, and unlike the Inspector you can put a breakpoint in it. Keep it in the repo next to the server.
// probe.js
import { Client } from "@modelcontextprotocol/client";
import { StdioClientTransport } from "@modelcontextprotocol/client/stdio";

const client = new Client({ name: "probe", version: "1.0.0" });
const transport = new StdioClientTransport({
  command: process.execPath,
  args: ["server.js"],
  stderr: "inherit",
});

transport.onerror = (error) => {
  console.error("[transport error]", error.constructor.name);
};

try {
  await client.connect(transport);
  const { tools } = await client.listTools();
  console.error("tools:", tools.map((t) => t.name).join(", "));

  const result = await client.callTool(
    { name: "count_words", arguments: { text: "the quick brown fox" } },
    undefined,
    { timeout: 5000 },
  );
  console.error("result:", JSON.stringify(result));
} catch (error) {
  console.error("call failed:", error.constructor.name, error.message);
  process.exitCode = 1;
} finally {
  await client.close().catch(() => {});
}
Three details in there are doing real work. stderr: "inherit" forwards the server's logs straight to your terminal, which is what makes the server's own output visible at all. transport.onerror catches the protocol-level errors that otherwise disappear. The explicit timeout of 5000 turns a hang into a fast, named failure.
npm run probe[wordcount] starting on stdio
tools: count_words
[wordcount] count_words in: "the quick brown fox"
[wordcount] count_words out: 4
result: {"content":[{"type":"text","text":"4"}]}Where does the client write its MCP logs?
When a server works under the Inspector but does not appear in your client, the problem has moved out of your code and into how the client launches it. The client's log is where that shows up. Claude Desktop writes to ~/Library/Logs/Claude on macOS and %APPDATA%\Claude\logs on Windows.
tail -n 20 -F ~/Library/Logs/Claude/mcp*.logTwo launch problems account for most of what you will find there. The working directory of a server started by a client is undefined, often / on macOS, so every relative path in your config or your .env is wrong. And a stdio server inherits only a limited, platform-dependent subset of environment variables, so the API key that works in your shell is simply absent. Use absolute paths in the config, and pass what you need through an explicit env block.
Frequently asked questions
Frequently asked questions
- Why does my MCP server tool call time out with no error?
- Check for a write to stdout with no trailing newline, such as
process.stdout.write("...")or a progress bar. The partial line joins the next JSON-RPC response, the combined line fails to parse, and the client's read buffer discards it silently. The reply is lost and the request waits until it times out. - Does console.log actually crash an MCP server?
- No. In
@modelcontextprotocol/client2.0.0, a stdout line that failsJSON.parseis skipped and the connection carries on. The tool call still succeeds and your log line is discarded with no warning. It is a silent bug, not a crash, which is what makes it hard to find. - How do I see the logs from my MCP server?
- Log to stderr with
console.error. The host application captures a stdio server's stderr automatically. When driving the server yourself, passstderr: "inherit"toStdioClientTransportso the output reaches your terminal. - How do I test an MCP server without connecting it to a client?
- Run the MCP Inspector in CLI mode:
npx @modelcontextprotocol/inspector@2.4.0 --cli node server.js --method tools/list. It starts the server, runs one method, prints the JSON result, and exits, so there is no UI or client restart in your loop. - My MCP server works in the Inspector but does not show up in my client. Why?
- The problem is almost always how the client launches it, not the server code. The working directory is undefined, often
/on macOS, and only a limited subset of environment variables is inherited. Use absolute paths in the config, pass secrets through an explicitenvblock, and read the client's log at~/Library/Logs/Claude/mcp*.logon macOS. - Should I use the MCP logging notifications instead of stderr?
- Not for local servers. Logging over the protocol with
notifications/messageis deprecated as of protocol version2026-07-28. Use stderr for stdio servers, and OpenTelemetry or your own log aggregation for Streamable HTTP servers, whose stderr the client does not capture.
The short version: define a log helper on console.error before you write your first tool, set transport.onerror so protocol errors have somewhere to go, and keep the Inspector CLI and a probe script within reach. Almost every stdio mystery resolves into one of the three cases above once you can see the stream.
Adding a server to MCPOrbit takes one short form. It connects over stdio or HTTP, and a server that will not start prints its reason above the Connect button, so the failure is a line you can read rather than a stream you have to reconstruct.
About the author
Mark
Head of Marketing, MCPOrbit
Mark leads marketing at MCPOrbit, the free desktop client for the Model Context Protocol. He writes the build-it and reliability guides, and the code in them is run before it ships.